Exponential growth of populations on Spaceship Earth will eventually
lead to limited resources which in turn leads to limited exponential
growth. What would the be the effect if no controls are placed on
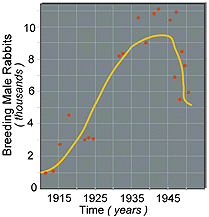
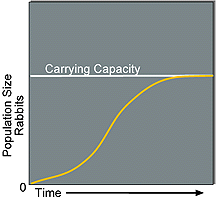
exponential growth? Study the results below showing two different
studies on rabbit populations. What determines which of these two
events may occur? Read the pages indicated by
Z-0.

|

|
In nature environmental resistance maintains populations at or below the carrying capacity of th environment. There are two classifications of environmental resistances, density-independent and density-dependent. Using your text define these two terms and give examples. At one extreme is a pattern of natural selection termed K-selection. Density-dependent factors regulate K-selected populations close to the carrying capacity. Individuals tend to be long-lived, to be late-maturing, and produce a small number of offspring that receive extended parental care. Examples are large mammal and bird populations. At the other extreme are r-selection populations. Density-independent factors strongly influence r-selected populations, which are rarely near the carrying capacity. Individuals of most such species are short-lived, reproduce at an early age, and have many offspirng that receive little care. Insects and other invertebrates live in strongly r-selected populations.
Write a paragraph contrasting between carrying capacity and population crashes and relate to density-dependent and density-independent factors. Write and give examples of r-selection and K-selection populations.
Which of the following would be considered K-selection?
- a. Resorption of embryos by marsupials when food supplies are depleted.
- b. New airborne lethal disease introduced into a population of rabbits.
- c. Fire destroys a large heavily forested area containing a large population of squirrels.
Which organism listed below are r-selected?
- a. mosquito population in a new pond
- b. oak trees in a forest
- c. porcupines in a lake
- d. cacti in a desert
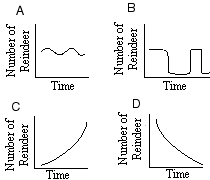
Click on the graph which shows a population curve for a reindeer population showing r-selection.

Created by the Multimedia Development Lab, Academic Technology Services.
Last modified November 19, 1997.